Official ONS data show that UK second-hand-car prices fell in June 2026, even as used-car sales activity returned to modest growth. The Office for National Statistics (ONS) recorded a 0.8% month-on-month fall in its Consumer Prices Index (CPI) measure for second-hand cars, with prices 1.2% lower than in June 2025. Separately, SMMT industry data show that 2,009,318 used cars changed hands in Q2 2026, up 0.7% year on year.
These figures measure different things. ONS tracks broad price movement, while SMMT records transactions. Neither is a valuation for a particular car, whose price can still vary with age, mileage, specification, condition, location and recorded history.
Quick Answer: Official ONS data show that the second-hand-car CPI index was lower in June 2026 both month on month and year on year. At the same time, SMMT industry data show that used-car transactions returned to modest growth in the second quarter. Price change and sales activity are different measures, so one does not automatically determine the other.
The latest official ONS picture for used-car prices
ONS publishes a dedicated CPI series for second-hand cars. It measures price change, rather than the average advertised price of a used car or the likely value of a particular registration number. This distinction matters when you are deciding whether to buy or sell.
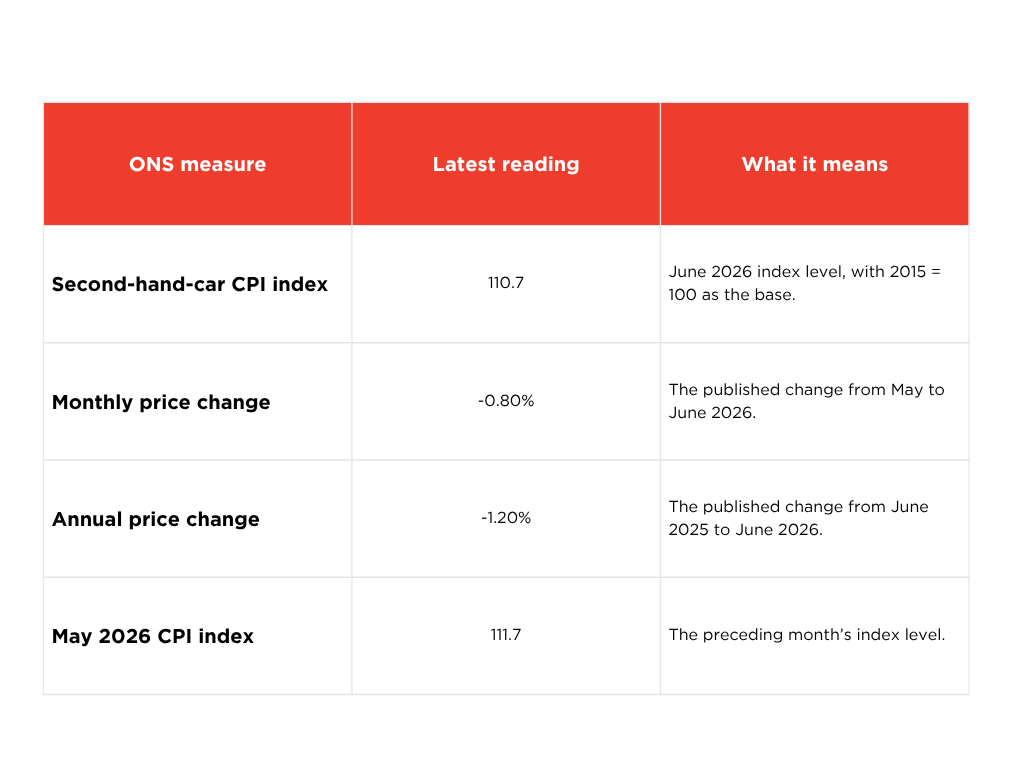
The latest release available when this article was checked covered June 2026. The ONS series had risen from 111.5 in January to 112.3 in April before declining to 111.7 in May and 110.7 in June. This shows why it is safer to use the official index than to make an assumption that all used-car values are moving in one direction.
What the ONS data does and does not tell you
The ONS index is the most appropriate source for a broad statement about used-car price movement. It gives a consistent national measure of change over time. It does not, however, say what a particular Ford, Volkswagen, Tesla or BMW is worth today.
A vehicle’s real-world price can diverge from a national index because buyers compare like with like. A low-mileage example, a desirable trim level, a full service record, a clean condition report or strong local demand can affect the price of one car. Conversely, high mileage, missing documentation, repairs, a weak specification or unanswered history questions can influence the value of another.
For that reason, use national data as market context, then assess the individual car. If you are buying, compare examples with similar age, mileage and specification. If you are selling, price transparently against comparable stock and be clear about the vehicle’s condition and paperwork.
Used-car activity returned to growth in Q2
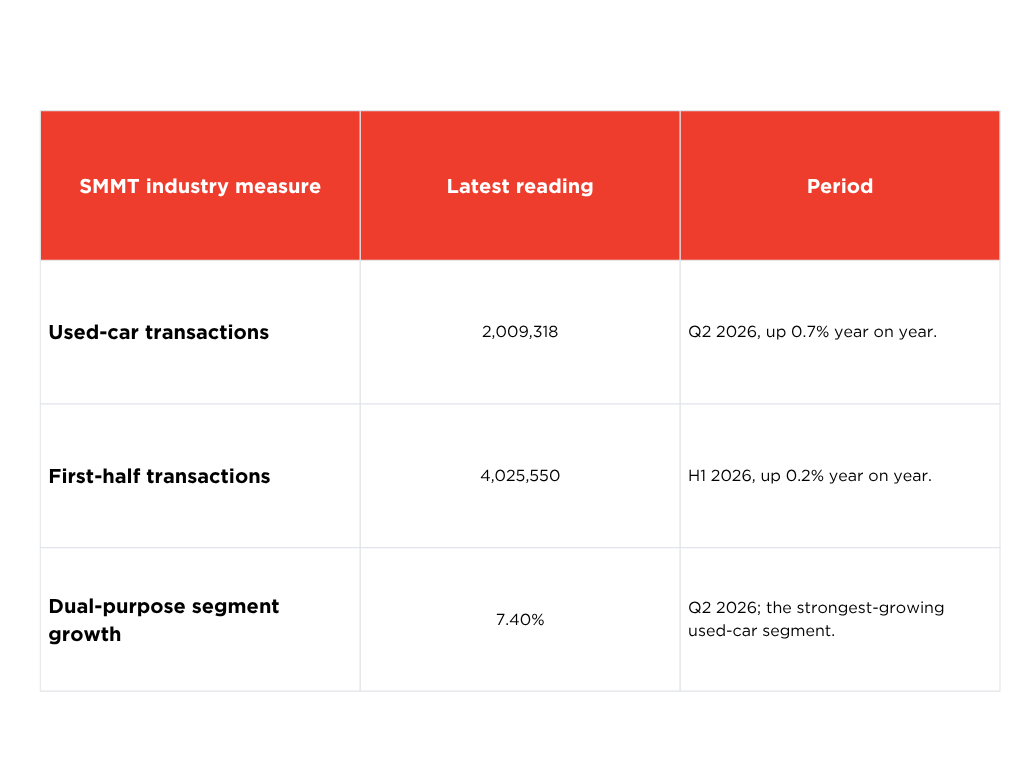
Price change is only one part of the market story. SMMT, the UK motor industry trade association, reports used-car transaction data supplied from DVLA information. Its latest release says 2,009,318 used cars changed hands in Q2 2026, up 0.7% year on year. Across the first half of 2026, transactions reached 4,025,550, up 0.2% on the same period in 2025.
Used EV, hybrid and conventional-fuel demand: keep price and sales separate
SMMT’s Q2 data show substantial variation in used-car transactions by powertrain. Used battery-electric vehicle (BEV) transactions rose 67.0% year on year to 110,761 units, accounting for 5.5% of used-car transactions. Hybrid transactions rose 31.2% to 130,825, while plug-in hybrid transactions fell 6.8% to 22,856. Petrol remained the largest category with 1,121,243 transactions in Q2, while diesel recorded 620,045. Together, conventional-fuel vehicles accounted for 86.7% of used-car transactions in the quarter.
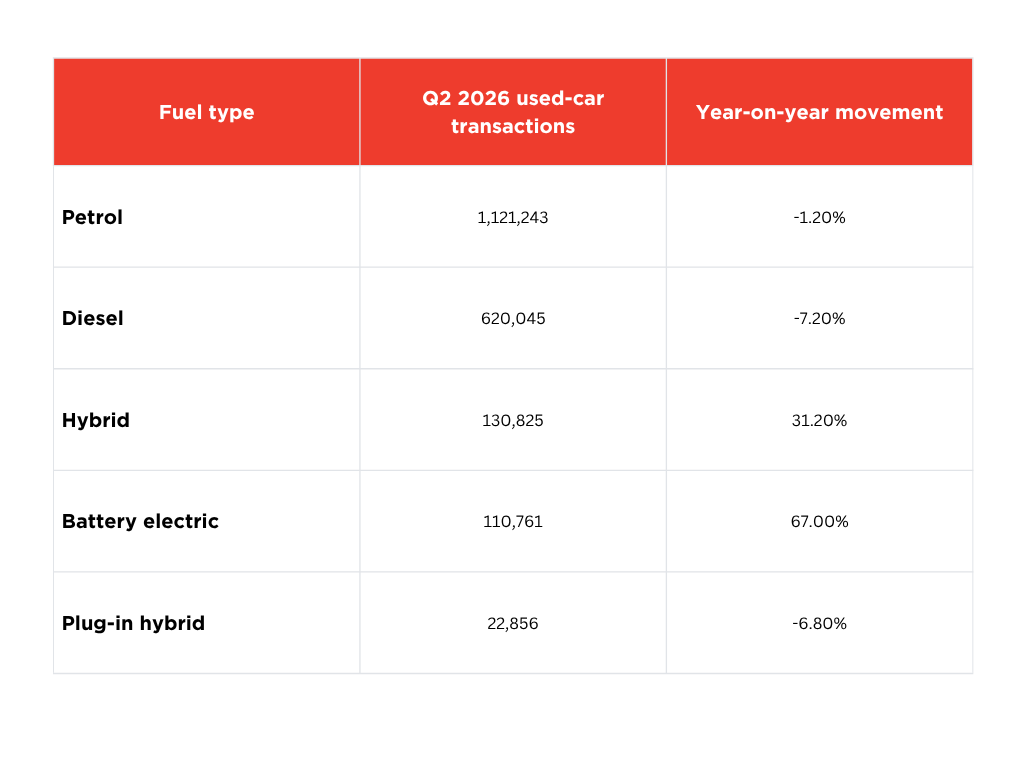
These are transaction figures, not price indices. They show which powertrains were changing hands, but they do not establish that a particular used EV, hybrid, petrol car or diesel car gained or lost value. When comparing individual vehicles, consider the driving pattern, charging access, running costs, maintenance history and condition alongside the asking price.
Britain’s most popular used cars in Q2 2026
SMMT’s Q2 transaction data show that familiar models continued to dominate the used market. The Ford Fiesta was the most frequently transacted model, followed by the Vauxhall Corsa, Volkswagen Golf, Ford Focus and Volkswagen Polo.
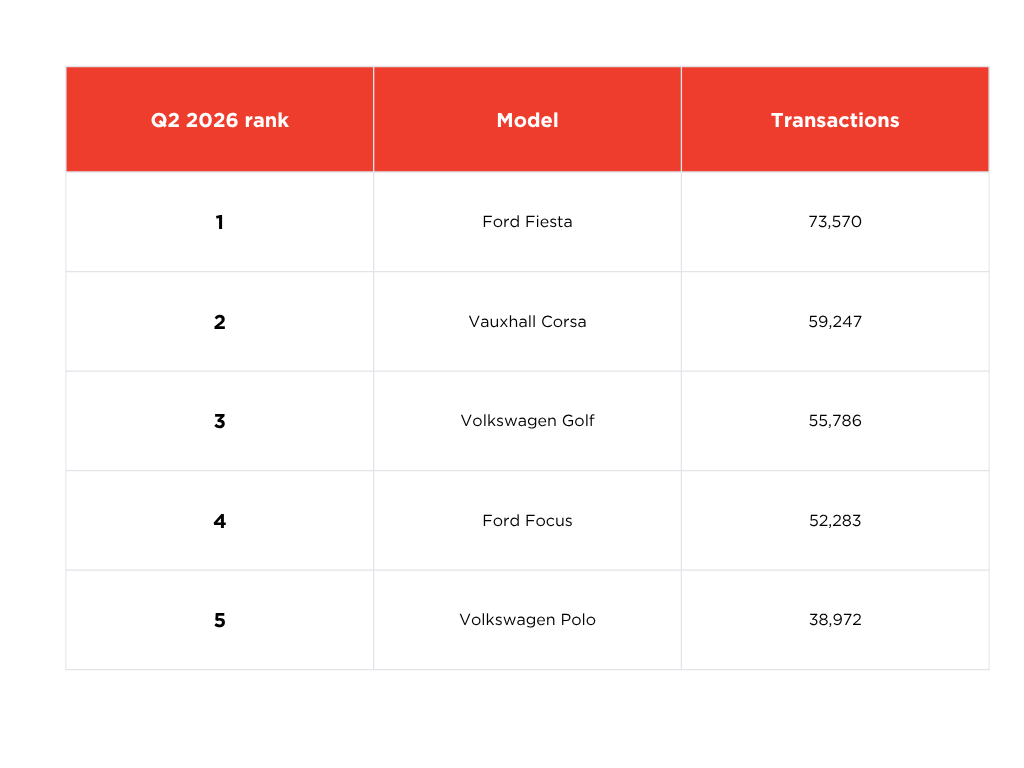
Popularity does not automatically make a particular example good value. It can simply mean there are more cars to compare. The important step is to assess the individual vehicle’s mileage, specification, service documentation, MOT record where applicable and history before you agree a price.
What this means before you buy a used car
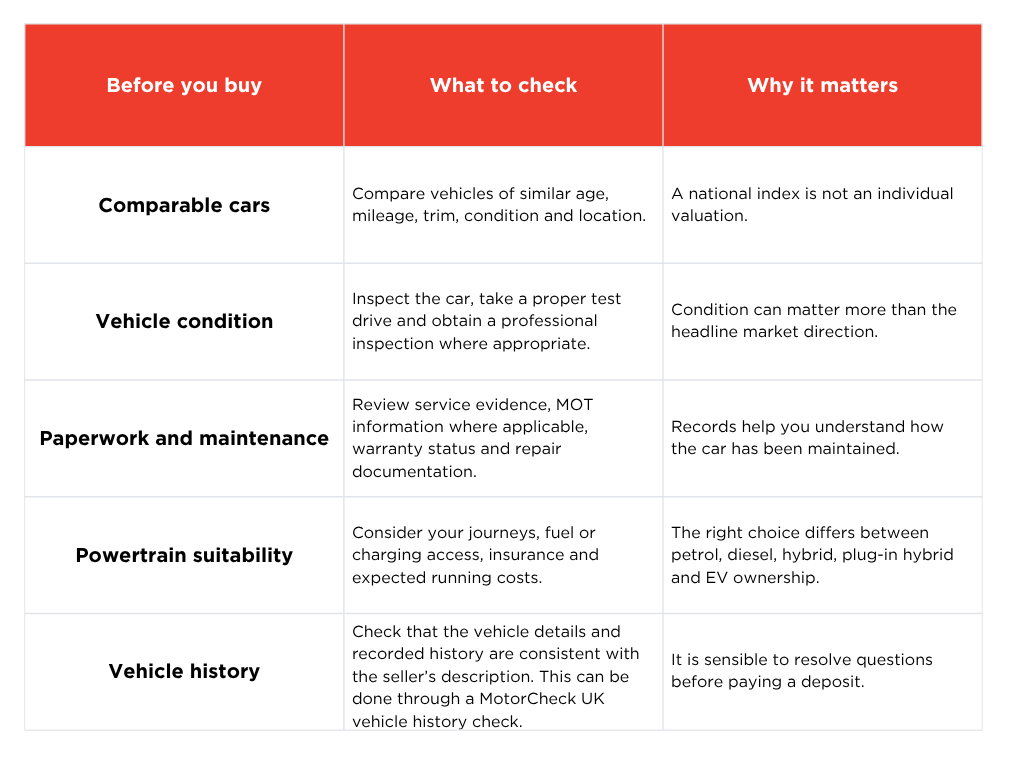
A falling national price index does not mean every seller will reduce their asking price, and it does not mean every car represents a good buy. Use the official data as a prompt to compare carefully rather than to rush a decision.
What this means if you are selling
The ONS data provide market context, not a pricing instruction. Start by checking comparable cars rather than anchoring your expectations to a broad national headline. Set out the vehicle’s exact specification, mileage and condition clearly, and make any known issues transparent. Clear information, good documentation and realistic pricing make it easier for a buyer to understand what they are being offered.
If you are considering a trade-in, compare offers on a like-for-like basis. Check whether an offer is subject to inspection, mileage limits, condition adjustments or a time limit. The most credible price is one that reflects the actual vehicle rather than a generic average.
Before you commit: get a MotorCheck UK vehicle check report
National price and sales figures provide useful market context, but they cannot confirm the background of the specific vehicle you are considering. Before you agree a purchase or pay a deposit, compare the car carefully, review the seller’s information and obtain a MotorCheck UK vehicle check report as part of your due diligence.
Ready to check a specific car? Get a MotorCheck UK vehicle check report before you buy.
Frequently asked questions about UK used-car prices
Are used-car prices rising or falling in the UK in 2026?
The latest official ONS data available at the time of publication show that the second-hand-car CPI index fell 0.8% in June 2026 and was 1.2% lower than in June 2025. The next ONS release should be checked before relying on this as the latest position.
Does the ONS index tell me what my car is worth?
No. The ONS index measures price movement across the second-hand-car category. A specific car’s value depends on factors such as its age, mileage, specification, condition, location and history.
Why can used-car sales rise when the price index falls?
Sales activity and price change measure different things. SMMT reports how many cars changed hands, while ONS tracks consumer price movement for second-hand cars. More transactions do not necessarily mean that prices increased.
Which used cars were most popular in Q2 2026?
SMMT’s top five models were the Ford Fiesta, Vauxhall Corsa, Volkswagen Golf, Ford Focus and Volkswagen Polo.
Are more used EVs changing hands?
SMMT reported that used BEV transactions rose 67.0% year on year in Q2 2026. This is a transaction statistic, not a separate used-EV price index; it should not be interpreted as a prediction of the value of an individual EV.
Sources
This article uses the ONS Consumer Prices Index for second-hand cars for broad UK used-car price movement. It uses SMMT industry data, which SMMT says are derived from DVLA-supplied information, for Q2 2026 transaction volumes, fuel-type trends and model rankings. These sources answer different questions and are identified separately throughout the article.
 by
by